Table of Contents
Description of metadata
If you dont use php on your webserver you can create your own client that returns JSON answers with the conventions described below.
Example
{
    "meta": {
        "host": "[{string} name of the computer]",
        "website": "[{string} description of the webapp]",
        "ttl": [{integer} ttl for the server gui],
        "result": [{integer}: 0..3],
        "tags": [
            "[{string} tag 1]",
            "[{string} tag N]"
        ],
        "time": "[{float} value]ms",
        "notifications": {
            "email": [
                "[{string} email_1@example.com]",
                "[{string} email_N@example.com]"
            ],
            "slack": {
                "#dev-channel": "[{string} https:\/\/hooks.slack.com\/services\/AAAAA\/BBBBB\/CCCCCC]",
                "#productowner-channel": "[{string} https:\/\/hooks.slack.com\/services\/XXXXXX\/YYYYYY\/ZZZZZ]"
                }
            }
        }
    },
    "checks": [
        {
            "name": "[{string}: short name of the test 1]",
            "description": "[{string}: a description what the test is verifying]",
            "group": "[{string}: name of a group (optional)",
            "result": [{integer}: 0..3]
            "value": "[{string}: result in words or {float} value for type=counter]",
            "time": "[{float} value]ms"
            "count": "[{float} counter value]"
            "visual": "[{string} bar|line|simple[,options]]"
        },
        ...
        {
            "name": "[{string}: short name of the test N]",
            "description": "[{string}: a description what the test N is verifying]",
            "group": "[{string}: name of a group (optional)]",
            "parent": "[{string}: name of a check (optional)]",
            "result": [integer: 0..3]
            "value": "[{string}: result in words]"
            "time": "[value]ms"
            "count": "[{float} counter value]"
            "visual": "[{string} bar|line|simple[,options]]"
        }
    ]
}
The response has 2 keys:
- meta: metadata for the check
- checks: container for all checks
Section “meta”
The meta key has these subkeys
-
“host”: [string: name of the computer] 🔸
This is the hostname. The server GUI for the monitoring can group by server. If you host several websites then these have the same “host”. -
“website”: [string: domain (and maybe path) of the webapp or any clear description. 🔸
Suggestion: [Application] - [vhost]/path, i.e. “My Wordpress blog - example.com/blog/”. -
“ttl”: [integer: ttl for the server gui] (optional)
Time to live value in seconds. The server GUI respects this value and does not ask the appmonitor client more often. A goof value for beginning is 60 or 300 (1 min/ 5 min) -
“result”: [integer: 0..3] 🔸
Result code of all checks of the webapp.
0 - OK
1 - unknown
2 - warning
3 - error
The server GUI will render the view by webapp by this result code. -
“tags”: array of tags (optional)
You can send tags to describe kind of tool, department/ developer team, whatever. In the server webgui you will see a list of all tags of all monitors and can filter them -
“time”: “[value]ms” (optional)
total time that was used for complete run of all checks The value must be a float in milliseconds plus additional “ms” (without space).
Example:"time": "0.628ms" -
“notifications”: notification targets (optional)
Here can be the subkeys (one, any or none)- “email”: flat list of emails
- “slack”: key-value list with a readable label for the target channel and the Slack webhook url
🔸 The keys “host”, “website” and “result” are required.
Section “checks”
The section “checks” is a container for the result of all checks. As an example: To verify the health of a webapp you need to check if the database is available, permissions exist on needed files or directories, if the port of a needed service is available. All these things are several single checks you have to put in the checks key for the response.
Subkeys in a check
Each check must have these keys:
-
“name”: [string: short name of the test N] 🔸
This string is for you - make it unique to identify it in the server GUI. i.e. “Mysql-db ABC” -
“description”: [string: a description what the test N is verifying] 🔸
This string is for you - you see the description in the server GUI i.e. “Check mysql-db ABC on the server db01” -
“group”: [{string}: name of a group (optional)]
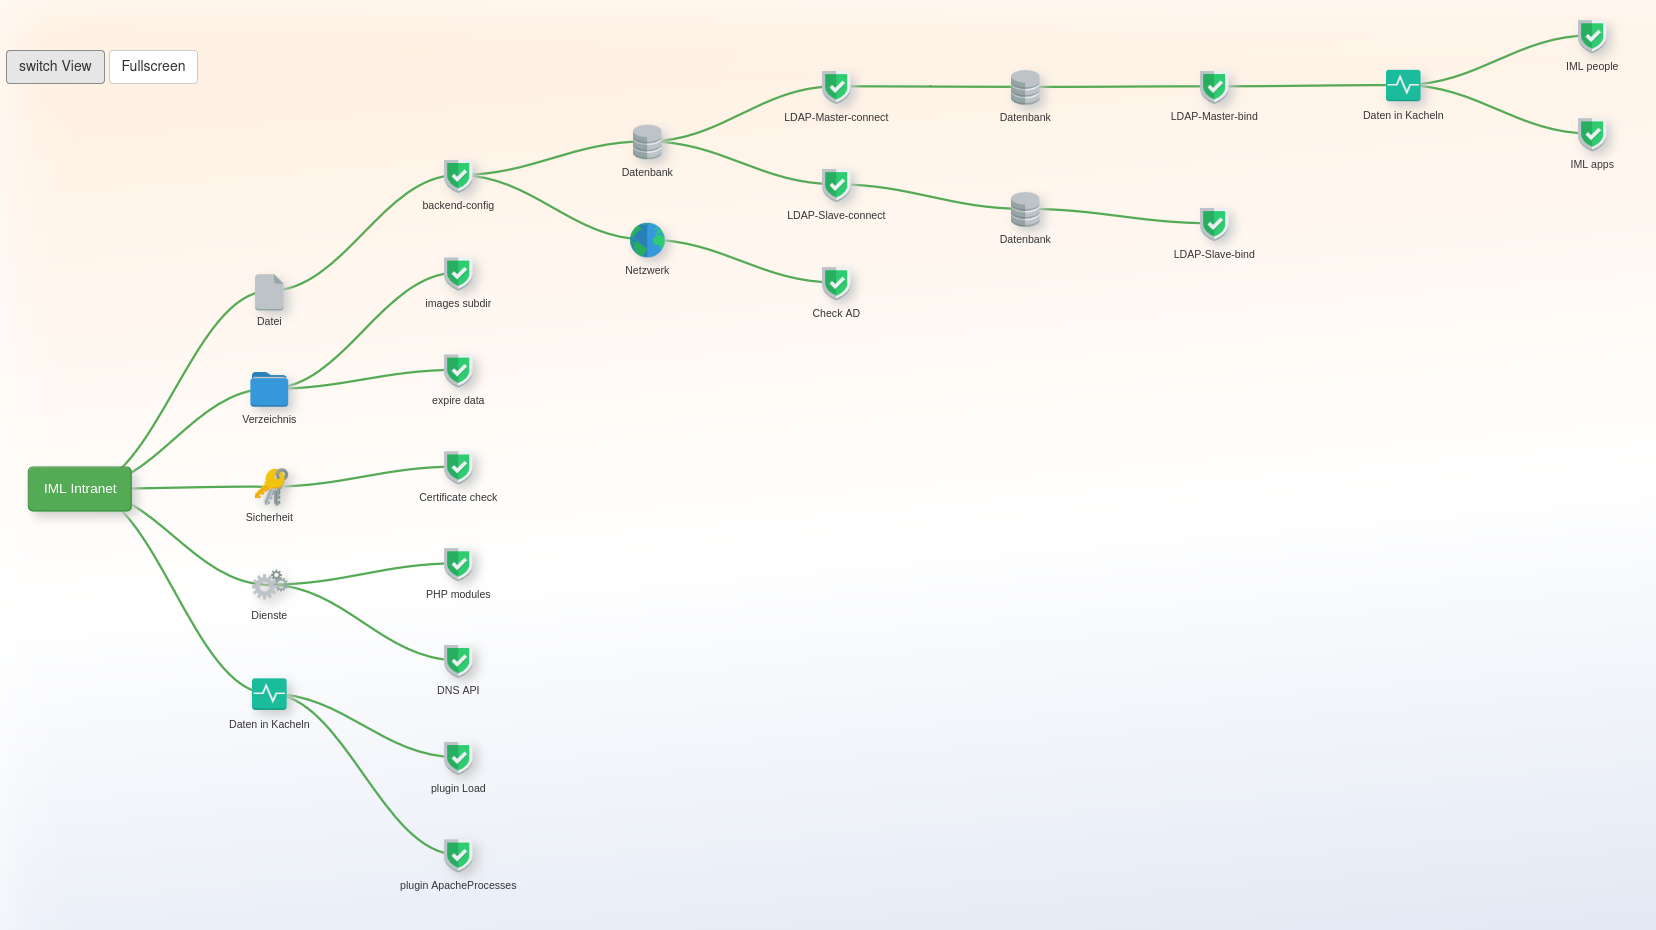
In the graphical view you can cluster checks by adding a group
Pre defined vaules and the shown labels are -
“parent”: [{string}: name of a check (optional)]
You can visalize a dependency tree by giving the “name” of the check the current check depends on. i.e. you must read the config first, where are database connection infos before you can check the database status. In the database check set parent to “read config” -
“result”: [integer: 0..3] 🔸
result code of the check. The values are the same like the result in the meta section. Based on the result code the server GUI renders the item for the check (i.e. green if OK, red on error) -
“value”: [string: result in words] 🔸
A human readable text of the result of the ckeck i.e.- OK, database was connected successfully
- ERROR: no write permission on file XY
-
“time”: “[value]ms” (optional)
time that was used for the single check. The value must be a float in milliseconds plus additional “ms” (without space).
Example:"time": "0.628ms" -
“count”: “[float: counter value]” (optional)
The value must be a float. If it is set then the server will store these values to render a graph with the last data items.
The value in “name” will be used as identifier of the stored items.
The type of graph is set with “visual” value.
Example:"count": 12.84 -
“visual”: “[string: bar|line|simple[,[width,[count]]]]” (optional)
The visual value works for type=counter only.
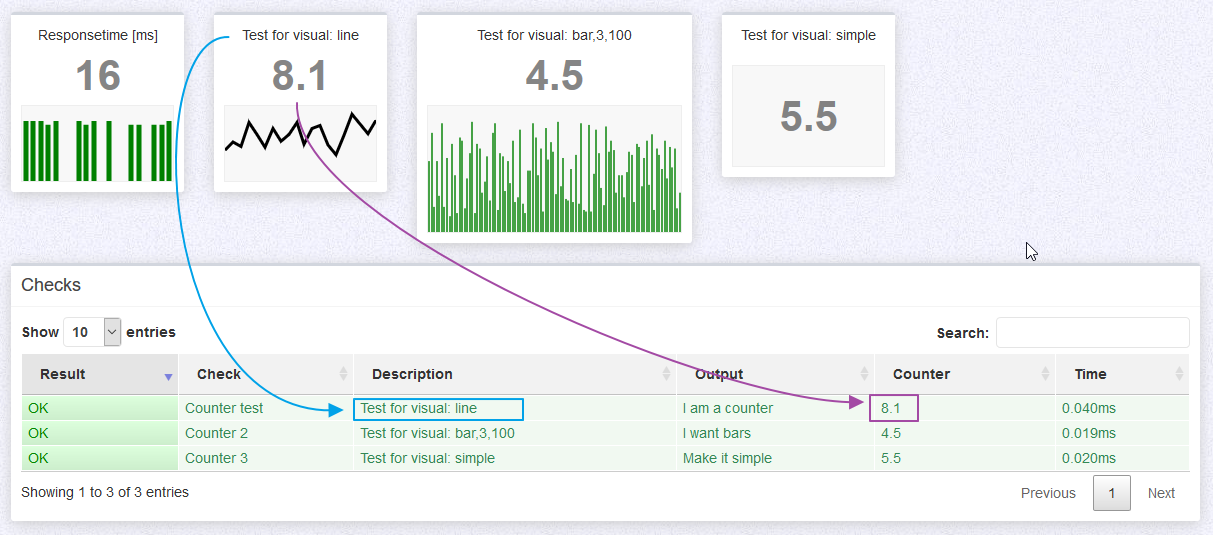
A tile with a counter shows a tile with “description”, a strong item “value” and a graph If missing the default is “bar” with a width of 2 colums showing the last 20 values.
Allowed types are- bar: show bars of thwe last n values. Each bar is colored by the result value of the check
- line: shows a line graph of the last values. the line has a single color only.
- simple: shows the value only without a graph
Behind the type can follow an integer for the width where the page width is 12 columns. The default is 2.
The last
🔸 The keys “name”, “description”, “value” and “result” are required.
Chaining
Valid values for “group” are:
| Group | Description |
|---|---|
| cloud | cloud icon |
| database | database icon |
| deny | deny sign |
| disk | hard disk icon |
| file | file icon |
| folder | folder icon |
| monitor | monitor graph icon |
| network | globe icon |
| security | keys icon |
| service | cogs icon |
Using the keys “groups” and “parents” result in chains in the graphical view:

Counter examples
The tile reponse time appears automatically without any configuration. All other tiles are the checks marked with “type”: “counter”.
Here is an example output of 3 styles and its source from the client.

{
  "meta": {
    (...)
  },
  "checks": [
    {
      "name": "Counter test",
      "description": "Test for visual: line",
      "result": 0,
      "value": "I am a counter",
      "time": "0.040ms",
      "count": 8.1,
      "visual": "line"
    },
    {
      "name": "Counter 2",
      "description": "Test for visual: bar,3,100",
      "result": 0,
      "value": "I want bars",
      "time": "0.019ms",
      "count": 4.5,
      "visual": "bar,3,100"
    },
    {
      "name": "Counter 3",
      "description": "Test for visual: simple",
      "result": 0,
      "value": "Make it simple",
      "time": "0.020ms",
      "count": 5.5,
      "visual": "simple"
    }
  ]
}